
Survey of Pentium® Processor
Performance Monitoring Capabilities & Tools
| Disclaimer Information in this document is provided in connection with Intel products. No license, express or implied, by estoppel or otherwise, to any intellectual property rights is granted by this document. Except as provided in Intel's Terms and Conditions of Sale for such products, Intel assumes no liability whatsoever, and Intel disclaims any express or implied warranty, relating to sale and/or use of Intel products including liability or warranties relating to fitness for a particular purpose, merchantability, or infringement of any patent, copyright or other intellectual property right. Intel products are not intended for use in medical, life saving, or life sustaining applications. Intel may make changes to specifications and product descriptions at any time, without notice. Copyright © Intel Corporation (1996). Third-party brands and names are the property of their respective owners.
|
Contents: |
Performance monitoring methods & tools for the Pentium® processor
are discussed.
Theory of operation of the Time Stamp Counter and the Performance Monitoring
Counters is discussed.
The following Windows* tools are surveyed, their methods summarized, and
their usages compared:
VTUNE*
PMON
PmonStat
EMON 1.0.8
EDBEMON
PTACH*
P5MON*
MTPM
PMX
Soft Logic Analyzer
Some of this information is available in data books or tool documentation,
but is collected here, to compare & contrast.
Some of these tools are Intel internal tools, which may not be available
publically. They are discussed here for informational purposes only.
The Pentium (and P55C) processor has built-in hardware features for
monitoring performance transparently in real time.
These consist of the Performance Monitoring Event Counters and the Time
Stamp Counter, which are implemented as four hardware registers
(Model Specific Registers 10h-13h):
| MSR# | Title | Name | Description |
| 10h | TSC | Time Stamp Counter | 64bit free-running counter, increments on every clock cycle. |
| 11h | CESR | Control & Event Selection | Selects which event each event counter will monitor |
| 12h | CTR0 | Counter 0 | 40bit event counter, counts occurrences or durations of a selected event |
| 13h | CTR1 | Counter 1 | 40bit event counter, counts occurrences or durations of a selected event |
Each event counter can monitor one of several dozen different "events" such as cache misses, instruction pairings, MMX™ instruction specific, etc.
Counter 0 and Counter 1 each have an associated output pin (PM0 and PM1), which can be programmed to signal each time the counter increments, or each time it overflows.
Use of the Performance Event Monitoring Counters is discussed next,
then use of the Time Stamp Counter.
3.0. Using the Performance Monitoring Event Counters
There are three general methods for using the event counters to monitor your code:
PMX, PMON, MTPM, with RDPMC; PmonStat
Characteristics of this general method are:
- You must add extra instructions to your code
- Only works on P55C (or later) processors (which have the RDPMC instruction)
- Any particular section(s) of your code can be measured
- Measurements consist of one or two event counts per section (not localized
any finer).
- Measurement is perfectly accurate and mostly transparent
- Code runs in real time (quickly)
- No hardware modification (i.e. EBS socket) is needed
The fundamental procedure (per event counter) is:
These steps cannot all be done in user-level (Ring 3) code because:
| (1) | CESR can only be set by the WRMSR (Write Model Specific Register) instruction; WRMSR can only be run from Ring 0. |
| (2,4) | The event counters could be read by the RDMSR (Read Model Specific
Register) instruction; but RDMSR can only be run from Ring 0. The counters can also be read by the RDPMC (Read Performance Monitor Counter) instruction; RDPMC can be run from Ring 3, if the CR4.PCE permission bit is set; but, in Windows95, CR4.PCE is not set by default. |
These difficulties can be addressed by the PMX, PMON, or MTPM programs.
PMX ("Privileged Mode eXecution")
PMX32 is a command line (DOS prompt) utility which runs under Win95 or
WinNT.
It allows the user to execute several different Ring0 commands, including
reading & writing Control Registers and Model Specific Registers.
The following PMX32 command sets CR4.PCE:
PMX32 WRCR 4 SET 8
With CR4.PCE set, user-level (Ring 3) code can execute the RDPMC command.
There is no way to allow user-level code to select which event is counted
(set CESR).
This selection can be done outside of user code, by using PMX again (recall
that CESR is MSR # 11h).
For example, the following PMX32 command sets Counter 0 to count "Data
Read Miss" events that happen in Ring 3:
PMX32 WRMSR 11 AND FFFFFC00 OR 00000083
(For definitions of the bits in CESR, see the references).
PMON ("Performance MONitor")
PMON is a Windows application which runs under Win95 (an older version
runs under Win31).
It can be used as a GUI alternative to the PMX method discussed above.
As a Ring 0 VxD, PMON does (among other things):
- sets CR4.PCE, so that user code can run the RDPMC instruction.
- allows the user to select events (set CESR) from a window or command
line;
- allows the user to select which privilege levels (0-2 and/or 3) the event
counting is enabled for.
MTPM ("MMX Technology Performance
Monitor")
MTPM is a Windows applications which runs under Win95.
It is similar to PMON, in that it provides a GUI method of selecting performance
events to monitor.
As a Ring 0 VxD, MTPM allows the user to set CR4.PCE.
After PMX, PMON or MTPM are run (and CR4.PCE set), user code can execute the RDPMC instruction:
| Name : | Read Performance Monitor Counter |
| Mnemonic : | RDPMC |
| Op code : | 0F 33 |
| Availability : | P55C (MMX Technology) or later processors |
| Description : | Reads either CTR0 or CTR1, depending on contents of ECX (0 or 1) Returns result in EDX:EAX (high 8bits in EDX, low 32bits in EAX) |
| Privilege : | Runs from Ring 3, if CR4.PCE is set (Ring 0 otherwise) |
The Microsoft MASM 6.11 assembler recognizes the RDPMC
instruction.
The Microsoft MSVC 4.1 inline assembler does not recognize it; it can be
simulated with the _emit command:
_emit 0x0F
_emit 0x33
A typical example of use in MSVC 4.1 is:
unsigned long StartH,StartL,EndH,EndL;_asm { mov ecx,0 ;select Counter0 _emit 0x0F ;RDPMC - get beginning value of Counter0 to edx:eax _emit 0x33 mov StartH,edx ;save beginning value mov StartL,eax } . . . . . . . . . . . . . . . . . . Measured code (C or ASM) . . . . . . . . . . . . . . . . . . _asm { mov ecx,0 ;select Counter0 _emit 0x0F ;RDPMC - get ending value of Counter0 to edx:eax _emit 0x33 mov EndH,edx ;save ending value mov EndL,eax } CountsL = EndL - StartL; //find difference, with 64bit subtract CountsH = EndH - StartH; if (EndL < StartL) CountsH-- ; printf("Your code incremented Counter0 %x %x times \n", CountsH,CountsL);
This method can be used to meter user-selectable sections of code for one or two different events (one for each counter) simultaneously. Remember that PMX or PMON must be used to select which event each counter monitors.
Inserting and executing the extra instructions, and saving the starting values disrupts caches & buffers (BTB, TLB, etc.) somewhat. (If you save values to disk, the disruption is larger). The code under measurement should be large enough to make this disruption insignificant. (It could be pre-run to set caches & buffers). Cache & buffer situation permitting, the "Instrumented" method can be used to monitor down to single-instruction lengths of code.
Another source of error is system interrupts (OS task switching, hardware,
etc): while your selected section of code is running, an interrupt could
occur, and events generated by the interrupt code would be counted in with
yours.
There are several ways of minimizing this problem:
- Clear the Ring 0-2 bit in CESR. This will exclude any Ring 0 events from
being counted with your Ring 3 code.
- Put CLI/STI around your code. (See the
discussion of CLI in the
Time Stamp Counter section
below.)
- Repeat the measurement many times, taking some statistic. (See the discussion
in the Time Stamp Counter section).
PmonStat
PmonStat is a library of routines which automate the instrumented-code
methods of using the performance counters,
and the timestamp counter. It includes C & assembly routines which
are inserted and linked into the user application, to allow selecting counters,
logging results, statistics and tabulating the output.
Features of PmonStat include:
- Has facilities for summarizing results, and aiding statistical analysis
(i.e. culling anomalous measurements).
- By including a 'kernel number' parameter with each call, statistics can
be maintained for up to 15 different sections.
- Automates looping a code segment through all the performance events for
the given processor.
- Automatically subtracts the (small) overhead of measurement functions.
- Allows selection of event measurement privilege level(s).
PMON, EMON, MTPM, P5MON, PTACH
Characteristics of this general method are:
- Event counts are from all active processes in the system (your code,
other processes, the OS, etc).
- Programs show a live update of event counts, and/or log the counts to
a file
- Programs are Windows GUI apps, which allow easy selection of events
The general procedure is:
Particulars for each program are discussed next.
PMON ("Performance MONitor")
- Runs under Win95 (older Win31 version is available)
- Documentation of VxD, API (DLL) and GUI are included. You can use them
to make your own custom monitoring app.
- MTPM uses PMON's core VxD and API.
MTPM ("MMX Technology Performance Monitor")
- Displays results in a real-time-updated "Events per second"
GUI display (only)
- Runs only in Win95 (uses a dynamically-loaded VxD)
- VxD & GUI API's (from PMON) are well documented; would be easy to
modify/add-to
- An MTPMPlus addition is available, for logging data to a file, which
can be imported into Excel.
EMON 1.0.8 ("Event Monitor")
- Does not have support for the MMX instruction specific events
- Can run, monitor and stop any particular program (from within the EMON
app)
- Can automatically log counter values at selectable time intervals
- Runs in Win31 or Win95
- Includes good documentation & online help
P5MON
- A public domain utility.
- Displays results in a real-time-updated "oscilloscope" GUI
display (only).
- Runs in Win31 or Win95
- Does not have support for the MMX instruction specific events
- Includes good on-line documentation, with architectural discussions
PTACH
- A commercial utility from NewCon.
- Displays results in a real-time-updated "oscilloscope" GUI
display
- Nice, robust user interface
- Runs on Pentium, WinNT, Win95
- PTACHPro also runs on PentiumPro, includes data logging, displays MSRs
10-13.
VTUNE EBS
VTUNE takes a different approach to the Performance Event Monitoring
Counters, with its "Event Based Sampling" (EBS) mode.
Features of Event Based Sampling are:
- requires a small hardware modification ("EBS socket") to Pentium
systems (not required on P6 systems)
- avoids having to add extra instructions (i.e. RDPMC, etc.) into your
code
- records each event's location in the code (to within about one instruction)
- measures the entire running application and system;
--after measurement, can mark a section to see event count for that section
- good accuracy requires long run times because
-- can practically sample only "every Nth" event occurrence;
-- can only measure one event type at a time.
The hardware modification amounts to disconnecting the processor's Non-Maskable Interrupt (NMI) input pin from the motherboard, and connecting it to the processor's PM0 output pin (Performance Counter 0 increment/overflow signal). In this way, PM0 drives NMI, so VTUNE (by providing an NMI handler) can record every Counter0 event that takes place.
The modification is normally done by removing the Pentium chip, and
adding an adapter socket between it and the motherboard (ZIF socket). This
"EBS socket" is actually two sockets plugged together: the bottom
one disconnects NMI from the motherboard, the top one connects NMI to PM0
(with a jumper wire).
Photos of a typical Pentium® EBS add-in socket, with NMI pin re-worked.
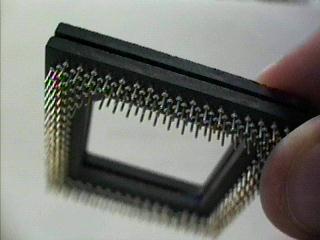 Figure
1 - Pentium® EBS add-in socket
Figure
1 - Pentium® EBS add-in socket
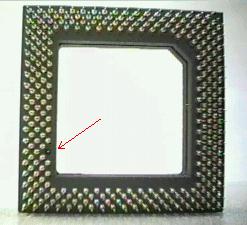 Figure
2 - Pentium® EBS add-in socket, showing NMI pin re-work
Figure
2 - Pentium® EBS add-in socket, showing NMI pin re-work
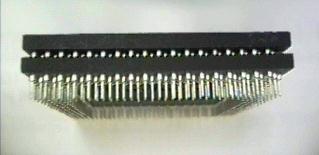 Figure
3 - Pentium® EBS add-in socket, showing double layers
Figure
3 - Pentium® EBS add-in socket, showing double layers
If the EBS socket is not installed, then View/ProjectOptions/Advanced will show the EBS-Host Processor Event-Based Sampling option grayed-out.
The EBS method can be intrusive, since caches and buffers are disrupted each time NMI is handled and the statistics are recorded (especially when the record is written to disk). If too many NMIs are generated, these interrupt effects will dominate the measurements. For this reason, VTUNE records (generates NMI for) only every "Nth" event. It does this by monitoring Counter0 overflows, and reloading Counter0 with "-N". "N" for each event is selected with its "Sample After" setting. More accurate measurement can be done by setting "Sample After" higher, and tracing for a longer time.
VTUNE has an automatic mechanism for setting "Sample After" and sample time. If "EBS Calibration Retry Count" is set >0, then EBS will automatically change the parameters and re-run the session, up to the maximum number of retries specified (see VTUNE on-line documentation for more details). If "EBS Calibration Retry Count" is set to zero, then any adjustments must be set manually. "Sample After" should be left high enough that fewer than about 1000 events per second are recorded. Sufficient accuracy can usually be obtained by running the code long enough to generate about 10000 events in the area of interest.
Given NMI's relatively high priority, VTUNE can also record where each event took place. Due to latencies in PM0 output and NMI response time, VTUNE can only localize each event to within about 3 cycles (typical), or about one instruction. (The true location will always be somewhere before its location in the EBS output).
VTUNE allows the user to select any number of the dozens of different
performance events. It runs these event selections one at a time, in separate
sessions, since it is fundamentally limited to one counter (event type)
at a time.
VTUNE's Dynamic Analyzer feature is different than the Event
Based Sampling feature.
The Dynamic Analyzer simulates the code and performance events, rather
than using the hardware registers to monitor actual running code. Characteristics
of the Dynamic Analyzer are:
- Does not require hardware modification (EBS socket).
- Simulates particular sections of code. Sections must be small, since
simulation runs slowly.
- Doesn't simulate outside the selected section, so cache & buffer
conditions may not be simulated correctly.
- Is able to show the exact instruction that causes each event (better
localization than EBS).
- Runs much slower than PMON or EBS methods, but does simulate many different
events simultaneously.
VTUNE can also do Time-Based Sampling, where interrupts are generated (and system state saved) at regular time intervals (instead of event counts). The periodic interrupts can be generated by the Real Time (CMOS) clock, by the Virtual Timer Device (8254 timer chip), by an NMI add-in card, or by the watch-dog timer on EISA bus systems.
EDBEMON (Event Domain Based
EMON)
EDBEMON is a stand-alone program for doing Event Based Sampling, similar
to that done in VTUNE. It requires the EBS socket for Pentiums. It includes
an API and documentation for integration into user tool applications.
4.0. Using the Time Stamp Counter
The Time Stamp Counter can be used to precisely measure the time (in cycles) spent in a section of code. It is a free-running counter which increments on every cycle (e.g. at 150MHz for a P55C/150), and is 64bits (low 32bits won't overflow for seconds; full 64bits won't overflow for centuries).
It can be accessed via the RDMSR/WRMSR instructions (Read/Write Model Specific Registers), but these are privileged (Ring 0) instructions which can't be used in normal user-level code. A new, non-privileged, instruction RDTSC (Read Time Stamp Counter) provides an easier way for user code to read the counter:
| Name : | Read Time Stamp Counter |
| Mnemonic : | RDTSC |
| Op code : | 0F 31 |
| Clocks : | 13 |
| Description : | Read the 64bit time stamp counter into EDX:EAX (high 32 bits in EDX, low 32 bits in EAX) |
| Privilege : | Can be run from any privilege level (Level 0 not required) |
The Microsoft MASM 6.11 assembler accepts the RDTSC opcode; the Microsoft Visual C 4.1 inline assembler does not. The instruction can still be implemented in MSVC inline assembly by:
_emit 0x0F
_emit 0x31
A typical example of use in MSVC 4.1 is:
unsigned long   StartH,StartL,EndH,EndL,Time;

. . . . . . . . . . . . .
. Pre-run measured code .       //optional
. . . . . . . . . . . . .

_asm
        {
        _emit 0x0F      ;RDTSC - get beginning timestamp to edx:eax
        _emit 0x31

        mov StartH,edx  ;save beginning timestamp (1 cycle)
        mov StartL,eax
        }

. . . . . . . . . . . . . . . . .
. Measured Code (C or ASM)      .
. . . . . . . . . . . . . . . . .

_asm
        {
        _emit 0x0F      ;RDTSC - get ending timestamp to edx:eax (13 cycles)
        _emit 0x31

        mov EndH,edx    ;save ending timestamp
        mov EndL,eax
        }

Time = EndL - StartL;   // Find time spent in measured code
Time -= 13;     // Subtract overhead cycles of RDTSC (assume 13)
Time -= 1;      // Subtract overhead cycles of MOV StartX,REG (assume 1)

if (EndH - StartH > 2) {notify} // usually high 32bits don't change much
Unfortunately, two factors cause the measured time to
vary (upwards) non-deterministically from the correct time:
- system interrupts (from OS task switching, etc.) that happen while the
measured code is running;
- data cache misses when storing the beginning timestamp (StartH,StartL).
System interrupts can be stopped by using the CLI instruction to disable all interrupts. Note that after issuing a CLI, the machine (mouse, keyboard, etc.) will be frozen until STI is issued, or until program flow returns to the OS.
The cache uncertainty in storing the beginning timestamp can be eliminated by pre-loading the cache, or by storing in registers (if the measured code doesn't need them).
With these two modifications, the sample code becomes:
unsigned long   StartH,StartL,EndH,EndL,Time;

_asm
        {
        mov edx,StartH  ;pre-load memory variables into data cache
        mov eax,StartL

        cli             ;disable interrupts
        }

. . . . . . . . . . . . .
. Pre-run Measured Code .       //optional
. . . . . . . . . . . . .


_asm
        {
        _emit 0x0F      ;RDTSC - get beginning timestamp to edx:eax
        _emit 0x31

        mov StartH,edx  ;save beginning timestamp (1 cycle)
        mov StartL,eax
        }

. . . . . . . . .
. Measured Code .
. . . . . . . . .

_asm
        {
        _emit 0x0F      ;RDTSC - get ending timestamp to edx:eax (13 cycles)
        _emit 0x31

        sti             ;re-enable interrupts

        mov EndH,edx    ;save ending timestamp
        mov EndL,eax
        }

Time = EndL - StartL - 13 - 1;
if (EndH - StartH > 2) {notify} // usually high 32bits don't change
As with any benchmarking, you must consider how the particular starting conditions of the cache & buffers (BTB, TLB, etc.) affect the timing of the code under measurement. Sometimes it is possible and desirable to run the code once in advance, to preset cache & buffers to known, repeatable conditions. In other situations, it is necessary or desirable to test the code "in-situ" with realistic cache & buffer conditions. The time stamp counter can be used to time down to single instructions, if cache & buffer situations are simple.
Note that inserting instructions, pre-loading cache, and
executing CLI, each
disrupt cache & buffers to some degree:
- The extra instructions will shift code cache slightly. Occasionally,
this (constant) effect could be dozens of cycles.
- Pre-loading the values into cache will overwrite an existing cache line,
which may be needed in the measured code.
- In Win95 user-level code, the CLI instruction
generates a GP fault which is transparently handled by the OS, eventually
giving the same result (IF cleared) as a regular CLI.
Cache & buffer disruption from this GP handling is usually small, but
occasionally is significant. Even so, using CLI
improves overall cycle count repeatability.
Since cycle count repeatability will not be perfect, single timings may not be sufficient for the desired accuracy. If the code under measurement is expected to run in a near-constant number of cycles, then single-cycle accuracy can be easily derived by running ~100 trials, and taking a simple statistic like the mode (most frequently occurring value).
Some routines are more difficult however, because
- Their execution times vary (widely) from call to call, so it's not easy
to say which spikes are real and which are noise.
- They cannot be easily isolated and run separately from the surrounding
code, with a constant input data set.
In these cases, the only solution is to average over a larger number of
trials. Very complex situations may require averaging a few million trials
to get single-cycle accuracy.
Soft Logic Analyzer
The Soft Logic Analyzer (SLA) tool uses the Time Stamp
Counter to trace software events.
SLA works by hooking into various software events, time-stamping and recording
them. These hooks can be calls which the user adds to his source code ("invasive
hooks"), or system events like hardware & software interrupts,
port activity and VMM activity ("non-invasive hooks"). SLA can
capture several "channels", and display them in tabulated (delta
time) format, or with time ticks (like a hardware logic analyzer).
Actual timing accuracy is limitted to about one microsecond, due to software
overheads.
Most platforms have a hardware counter running at 1.19Mhz (accurate to 0.8mS). In Win32, this timer can be easily accessed with the QueryPerformanceFrequency()and QueryPerformanceCounter()functions.
From Win16, more (assembly level) programming work is required, to access the counter as the Virtual Timer Device (VTD). This is discussed in Timers and Timing in Microsoft Windows (on Microsoft Developer Network).
Windows programs can also access the system timer through
the TimerCount()and
related functions. This timer normally has a resolution of 1mS.
Each of the Pentium performance monitoring tools provides a different mix of accuracy, transparency, and ease of use. These are summarized in the following table:
| VTUNE EBS Event-Based Sampling |
VTUNE Dynamic Analyzer |
EMON, PMON, MTPM etc |
PMON, PMX, etc (RDPMC) |
TimeStamp Counter, S.L.A. |
|
| Requires extra instructions | no | no | no | yes | yes |
| Code size measured | entire app. | small section | entire app. | any | any |
| Localization | ~1 instr. | perfect | entire app. | section | section |
| Event Count Accuracy | good | fair | very good | very good | n/a |
| Measurement Time | long | long | real | real | real |
| EBS Socket required | yes | no | no | no | no |
This table is only a rough summary, and is not absolute. Some of the
ratings can vary depending on the particular situation. Any of the methods
could actually be "the most accurate" or "the fastest",
depending on your particular needs. Often some combination of methods will
be best, such as
- EBS on the application, followed by Dynamic Analyzer to better localize
a few hot spots; or
- PMON on sections, followed by Time Stamp Counter (before & after)
to see how much speedup your improvements actually produced.
1995 Pentium® Processor Family Developer's Manual, Volume 1, Chapter
33 (Model-specific registers)
1995 Pentium® Processor Family Developer's Manual, Volume 3, Chapter
25 (Instruction set)
Intel Architecture MMX™ Technology Developer's Manual, Chapter 6 (Performance Monitoring Events).
Software
| Name | Ver. | Date | Author / Company | Availability | Web site |
| P5MON | - | 5/95 | P. O'Carroll | public | The System Utility section of the SimTel Archive |
| PTACH | - | 5/96 | NewCon | commercial | http://www.ncsw.com/ |
| PTACH | Pro | 7/96 | NewCon | commercial | http://www.ncsw.com/ |
| VTUNE | 2.1 | 12/96 | Intel | commercial developers |
Intel's Developer Web Site |
