 The Intel Power Monitor has a simple set of menus and controls. You can activate the Intel Power
Monitor program by starting it from the Windows* Run menu or by double clicking it in Explorer.
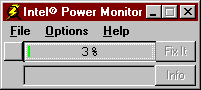
Along with the standard title bar and menu items, the Intel Power Monitor displays a bar gauge
(power bar) that graphically represents the amount of non-idle system activity in your system. This
display updates approximately once per second.
The Intel Power Monitor has a simple set of menus and controls. You can activate the Intel Power
Monitor program by starting it from the Windows* Run menu or by double clicking it in Explorer.
Along with the standard title bar and menu items, the Intel Power Monitor displays a bar gauge
(power bar) that graphically represents the amount of non-idle system activity in your system. This
display updates approximately once per second.
The color bar indicates CPU activity due to the software currently active.
- Green indicates low activity.
- Yellow indicates that the system is active 75% or more of the time.
- Red indicates that the processor was unable to go idle during the last measurement period.
To the right of the power bar is a Fix It button that indicates that the Intel Power Monitor has
detected a behavior that it can correct (when not grayed out). Underneath the power bar is an area
that displays the name of the offending application. You can click the Info button to obtain further
information about the reported application.
Superimposed on the power bar is the percentage of non-idle CPU activity during the last measuring
period.
 Mini Bar (Simulation)
Intel Power Monitor also has a small button to the left of the power bar that you can click to change
modes from Normal to a Mini Bar to reduce the screen area used by the display. The Mini Bar
initially locates itself on the upper portion of your screen. You can position the Mini Bar anywhere
on your screen by placing the cursor over the power bar area, pressing and holding the left mouse
button, and then dragging the Mini Bar to the location of your choice.
System Activity and Power Management
Power management software extends battery life by shutting down the disk, display, processor, and
other parts of your notebook computer when those parts are not performing useful work. Power
management software usually resides in the system BIOS, but may reside in the operating system.
High non-idle CPU activity is not necessarily bad. For example, when a spreadsheet recalculation
occurs, high processor activity is expected to complete the recalculation in a short time. However, if
your software application is waiting for you to provide some input (e.g., choosing a font or filename
in a dialog box), the processor should be inactive. The Intel Power Monitor will indicate this low
activity by displaying a short green bar and a percentage value, typically under 25%. If you see a
red bar instead, your application may be wasting power.
By fixing software that wastes power, the software vendor allows the power management features
of your notebook computer to extend battery run time by reducing power consumption. The
primary characteristic of a power-wasting application is a Power Monitor display that remains in the
red for extended periods of time, when the application is waiting for you to type a character or
choose an option with the mouse.
Fix It Button
If an application does not allow your system any idle time and the Intel Power Monitor has
determined that the cause is fixable, the Fix It button will be enabled. Clicking this button causes the
system to rest for brief periods of time. This rest time will be so short that you will not notice any
difference in the way your application behaves. Behind the scenes, however, your battery life will be
extended.
If you fix an application, you can undo the fix later (See the Fix Table section in Power Monitor's
online help). The fixed application will display "Intel Power Monitor: FIXED" in its title bar, and the
Intel Power Monitor itself will display the number of fixed applications in its title bar.
